Exploring publication places (spatial data)
Overview
Teaching: 10 min
Exercises: 20 minQuestions
How do we create simple geomaps depicting new items in our collection?
Objectives
First objective.
Exploring publication places
Maps offer the possibility to show quantitative information, spatial patterns and relations - which can be interesting in a library context. For instance, using data from Alma Analytics, one could geographically visualize Inter Library Loans over time, or one could investigate the publication places of books in library collections.
Google Spreadsheets has some features to create geomaps, even though they are not as advanced as other tools. In this lesson, we try out these features using the publication places in our New Physical Materials dataset – a column which may need some cleaning and preprocessing (for instance using OpenRefine, as introduced in a Library Carpentry lesson).
Exercise 1: Creating a basic geomap
Go to the NewItems worksheet that we created before [todo: add link], and select all rows and columns (ctrl+A). Now, choose
Data>Pivot Table.
- In the pivot table, select Rows:
add field, and addPublication Place- Under Values, also add
Publication Place. SetSummarize bytoCOUNTA.- Add a Filter. Again,
Publication Place, and deselect theblanksvalues.If you wish, you can also add another filter for a particular library or collection which you are interested in. Otherwise, just continue with the next step.
- Sort the Rows by
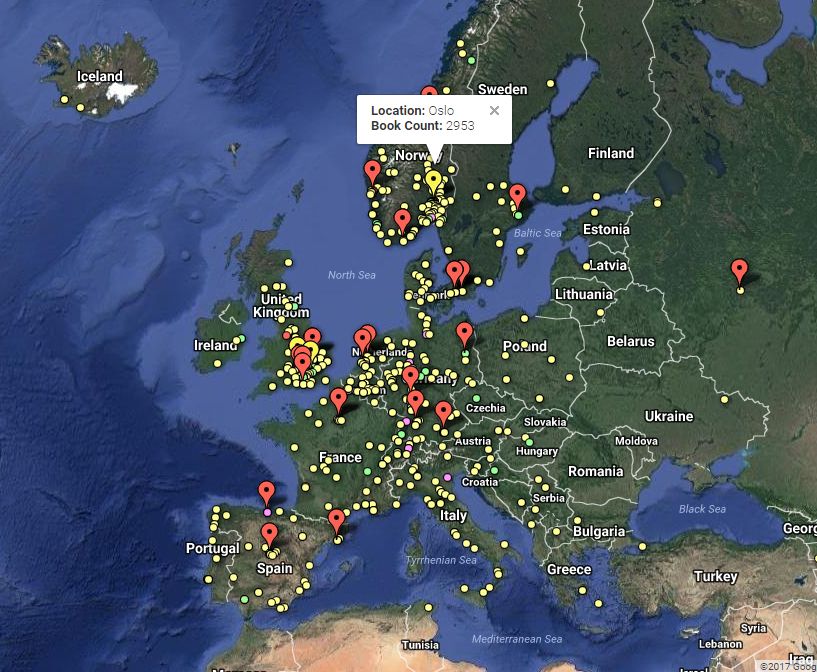
COUNTA of Publication Place, and deselect show totals.- Select all data in our pivot table (ctrl+C), and choose
Insert>Chart. InChart type, choose the second chart under the mapMapcategory (thegeo chart with markers).Now, we can already admire our newly created map. Please note that Google Sheets is still ‘geocoding’ the city names that occur in our table. Geocoding is the process of finding latitute and longitude coordinates for geographical places described in text. Thus, you may observe that cities are still being added to the map as we speak. You can hover over places on the map, and see how many new items are published in a certain city. Perhaps unsurprisingly, Oslo constitutes a large marker on the map.
- To customize the map, use the chart editor box in the right. Here, you can change the colors and region of the map (choose
Customize). Change the background color, and view the different available regions.
Experiment with adding some filters to the pivot table, so you can e.g. explore which publication places are associated with different Dewey numbers, or which places are associated with you favorite UiO library.
By clicking the three vertical dots in the top-right of the map, you can also Publish your map to the web, or embed it on your website.
These kind of visualizations could be used for various purposes. For instance, to enrich the automatically generated pages showing newly acquired books on a library websites. These lists are shown on the following website [todo: add UiO link], for example, but could be presented more visually.
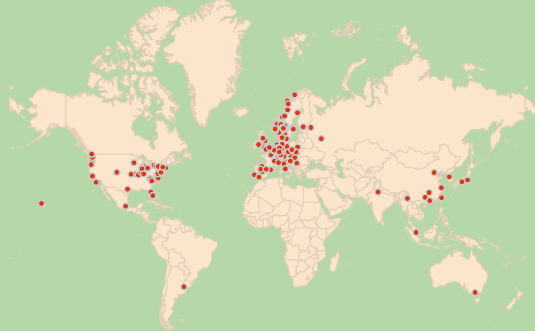
Other tools (e.g. Google Fusion Tables) offer far more advanced features for the creation of maps. These kinds of tools offer a wealth of opportunities for visualizing data on a map, and for adding interactivity to a map. Be sure to try them out when possible.
Example of a customized map in Google Fusion Tables, with the possibility to add interactivity and filters. It was made by saving the previously created pivot table as a csv, importing it to Fusion Tables and customizing the display. Check out the example.
Read more
- Google Fusion Tables gallery: sites.google.com/site/fusiontablestalks/stories
- Google Fusion Tables tutorials: https://support.google.com/fusiontables/answer/184641
Key Points
Maps can visualize quantitative information
Using Pivot tables, one can prepare data for visualization on maps
An important part of geomapping is ‘geocoding’, getting the geographical coordinates of a place described in a textual field
Specialized tools, such as Google Fusion Tables (free), or a variety of paid tools (e.g., Tableau), offer more advanced functionality for geomapping than tools like Google Spreadsheets.